Description
A leader is one or more lines with an arrowhead at one end. Place the Leader into the Viewport where you want it to show.
2 points will make 1 leader line, 3 points will make 2 leader lines and so on.
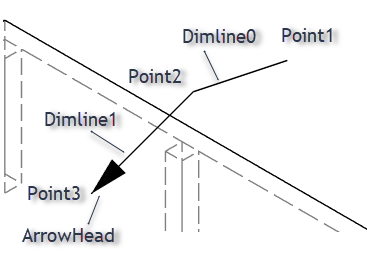
Point1 Point2 Point3
[p(.625,.425,0),p(.325,.325,0),p(0,0,0)]
Parameter Rules
| pointList: | List of points for the leader. |
| Example: | [p(.625,.425,0),p(.325,.325,0),p(0,0,0)]; |
| arrowSize: | Size of the arrow head |
| Example: | 0.125; |
| arrowStyle: | Style of arrow at the end of the dimension lines. |
| Example: | "filledArrow"; |
| Choices: | "triangle", "filledTriangle", "filledArrow", "circle", "filledCircle" |
Mixins
BaseAssembly
AssemblyRenderMixin
Render3Mixin
FrameMixin
AssemblyMixin
FrameMixin
BaseNode
BaseModel
RULE NAME |
TYPE |
DEFAULTS |
CATEGORY |
FLAGS |
|---|---|---|---|---|
pointList |
array |
[] |
Leader |
Cached
|
arrowSize |
number |
1.0 |
Leader |
Cached |
arrowStyle |
string |
"filledTriangle" |
Leader |
Cached lookup |

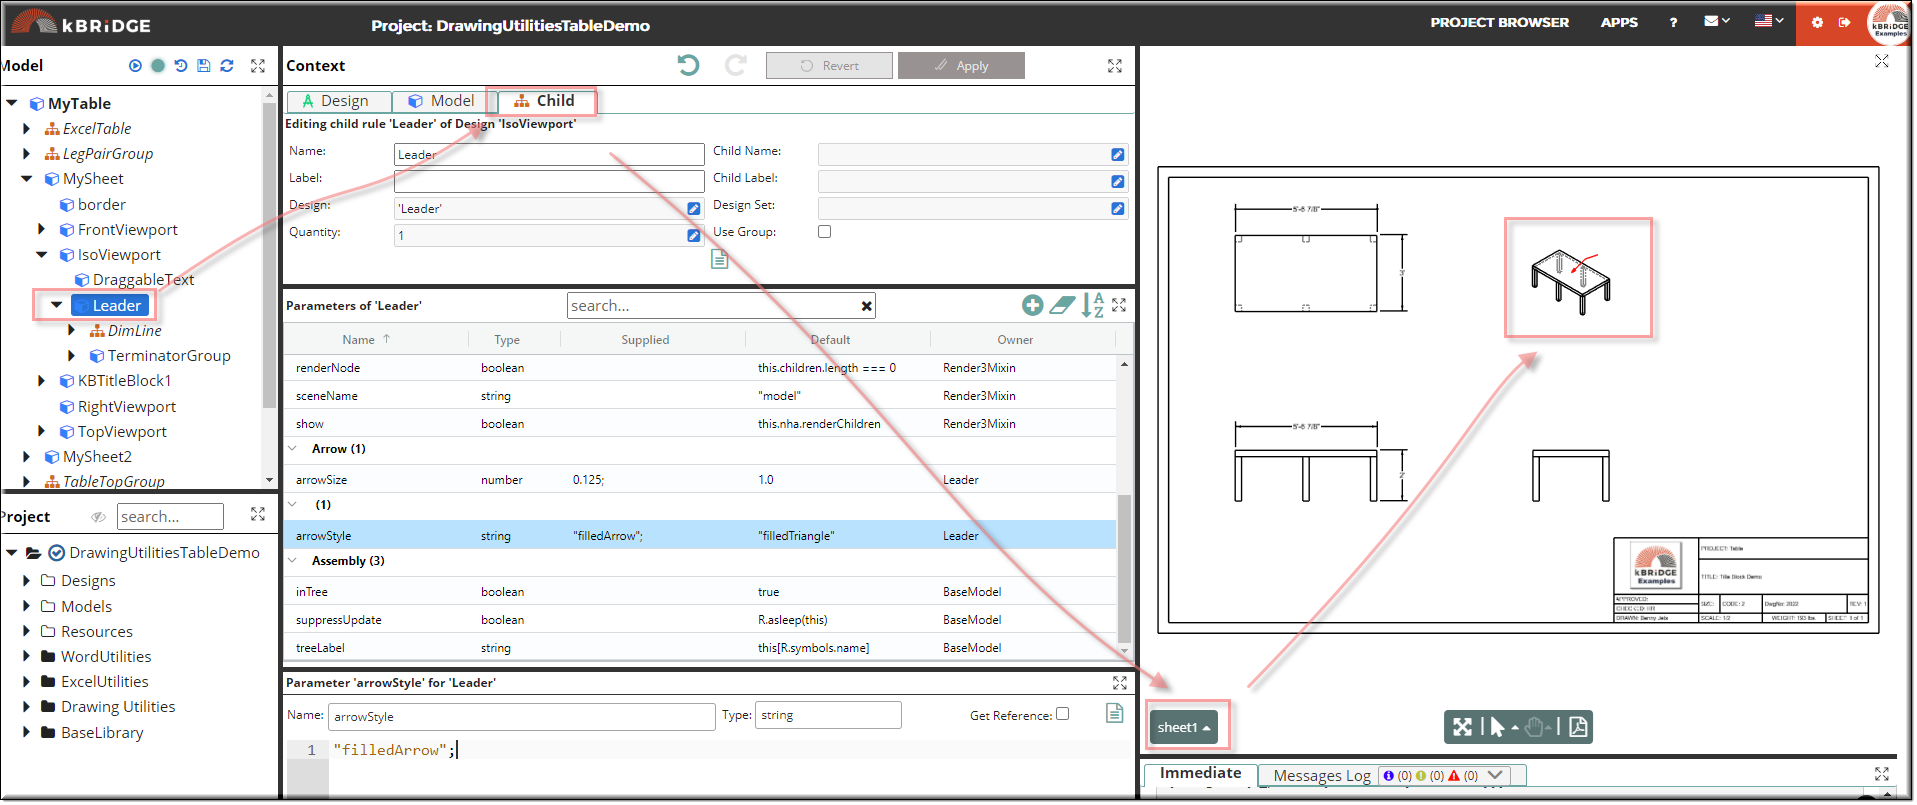
Project Example:
In your kBridge Examples Projects folder open the project called ‘DrawingUtilitiesTableDemo’.
Reference Location:
“'world.mytable.mysheet.isoviewport.leader'”
Link: https://knowledgebridge.engineer/projects
Open the DrawingUtilitiesTableDemo project.
Click on the Leader/Child Tab/Sheet1 to view the Leader example and view the parameter values. A DraggableText can be added to the end of the Leader. See DraggableText.